2.18 - to appear in the Preprint Volume of the Third Conference on Coastal Atmospheric and Oceanic Prediction and Processes, 3-5 November 1999, New Orleans, LA, American Meteorological Society, Boston, MA
REALTIME FORECASTING OF THE MULTIDISCIPLINARY COASTAL OCEAN WITH
THE LITTORAL OCEAN OBSERVING AND PREDICTING SYSTEM (LOOPS)
Allan R. Robinson
Harvard University, Cambridge, MA
and the LOOPS Group
1. INTRODUCTION
The Littoral Ocean Observing and Predicting System (LOOPS) concept is that of a generic, versatile and portable system, applicable to multidisciplinary, multiscale generic coastal processes. The LOOPS advanced systems concept consists of: a modular, scalable structure for linking, with feedbacks, models, observational networks and data assimilation and adaptive sampling algorithms; and an efficient and robust, integrated and distributed, system software architecture and infrastructure. LOOPS applications include scientific research, coastal zone management and rapid environmental assessment for naval and civilian emergency operations. The LOOPS design is the scientific and technical conceptual basis of an interdisciplinary national littoral laboratory system. The LOOPS partners include: J.G. Bellingham (MBARI), C. Chryssostomidis (MIT), T.D. Dickey (UCSB), E. Levine (NUWC), N. Patrikalakis (MIT), D.L. Porter (JHU/APL), B.J. Rothschild (Umass-Dartmouth), H. Schmidt (MIT), K. Sherman (NMFS), D.V. Holliday (Marconi Aerospace) and D.K. Atwood (Raytheon). LOOPS objectives and accomplishments are summarized in the final section of this note.
A demonstration of the real-time interdisciplinary forecast concept for a LOOPS prototype system took place in Massachusetts Bay from 17 August to 5 October 1998. The scientific focus was phytoplankton and zooplankton patchiness, in particular, the spatial variability of zooplankton and its relationship to physical and phytoplankton variabilities. Simultaneous synoptic physical and biological data sets were obtained over a range of scales. The multi-scale sampling strategies were based on: (1) ocean field forecasts with the Harvard Ocean Prediction System (HOPS, Robinson, 1999) assimilating all prior data (regions of most active or interesting dynamics) and (2) forecasts of error variances and of dominant eigendecompositions of error covariances, using Error Subspace Statistical Estimation (ESSE, Lermusiaux and Robinson, 1999). All of the sampling patterns of these platforms and sensors were designed and made available in real-time; assimilating yesterday's data today for tomorrow's forecast and sampling. This data was assimilated using standard optimal interpolation (OI) and ESSE. Real time forecasts of fields and error covariance eigendecompositions were provided. These accomplishments have resulted in a combined and compatible physical, biological, and chemical multi-scale data set applicable to interactive process studies and data assimilation, adaptive sampling, and predictive skill OSSEs. Several dynamical interactions among the circulation, productivity and ecosystem systems will be presented.
2. SYSTEM CONCEPT AND ARCHITECTURE
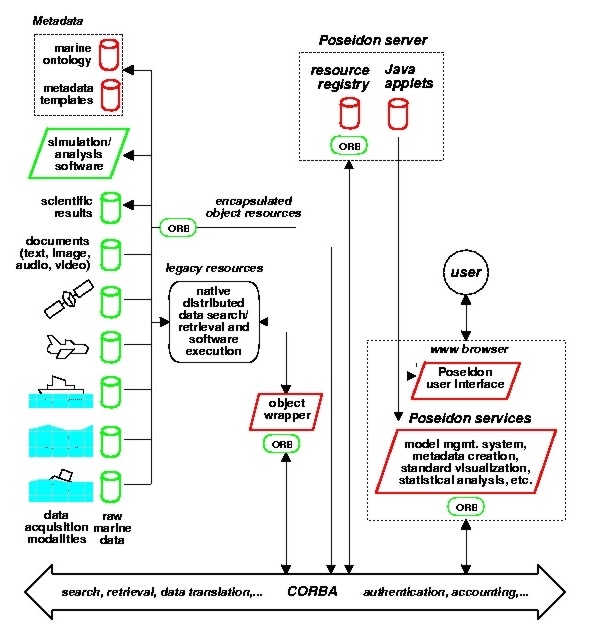
The concept development effort has focused on: (1) defining and developing the conceptual basis for the software and database components; (2) researching and designing data and software standards; and, (3) designing the LOOPS architecture as a distributed, modular, flexible, and scaleable system that is compatible with a wide-range of hardware and operating system platforms (Patrikalakis et al. (1999)). The LOOPS system architecture, named Poseidon, is architecturally, a major knowledge networking construct. It is a network of distributed data and software resources, communicating with one another across a Common Object Request Broker Architecture (CORBA) backplane (Figure 1). The standard user's environment is a CORBA-enabled web browser, to which the Poseidon User Interface and Model Management System are automatically downloaded as Java applets from a single centralized Poseidon server. As the system utilization grows, however, geographically dispersed multiple instances of the server may be established, with the necessary provisions for the concomitant problems of data consistency. The Poseidon server also maintains a resource registry, which identifies the resources that are available for metadata searches and for data access Resources include marine ontology, metadata templates, measured ocean data (and in fact the platforms or robots collecting such data), documents (text, image, audio, video), scientific simulation/analysis software and simulation data (scientific results). Newly developed resources can be constructed directly as CORBA-compliant objects. Legacy resources, on the other hand, require an object wrapper, which is composed of a CORBA front-end and a back-end that supports the resource-specific communication protocol (e.g. HTTP, ftp, etc.). Wrappers have been developed for two modules of HOPS and an acoustic model used by the MIT Ocean Engineering Acoustics Lab
|
|
|
Figure 1: (Left) Poseidon system architecture; (Right) High-level ocean observing and prediction system architecture.
3. MASSACHUSETTS BAY SEA TRIAL
The Massachusetts Bay Sea Trial (MBST-98) was an interdisciplinary forecast experiment (see Introduction and Table). MBST-98 utilized interactive multi-scale adaptive sampling for three research vessels and two fleets of Autonomous Underwater Vehicles (AUVs). This demonstration of concept was performed in collaboration with the Advanced Fisheries Management and Information Service (AFMIS, Rothschild et al., 1999) and Autonomous Ocean Sampling Network (AOSN, Curtin et al., 1993) programs. The sea trialÆs objectives included: engineering trials; system integration (sensors and platforms, observations and models); demonstration of concept (real time multifield nowcasting and forecasting. The scientific objectives relate directly to both management and fundamental research issues. The specific scientific objectives were to: (1) obtain simultaneous synoptic physical and biological data sets in 4 dimensions; (2) assimilate data into a set of coupled interdisciplinary nested models; and, (3) analyze and interpret the data, and interdisciplinary simulations with assimilated data.
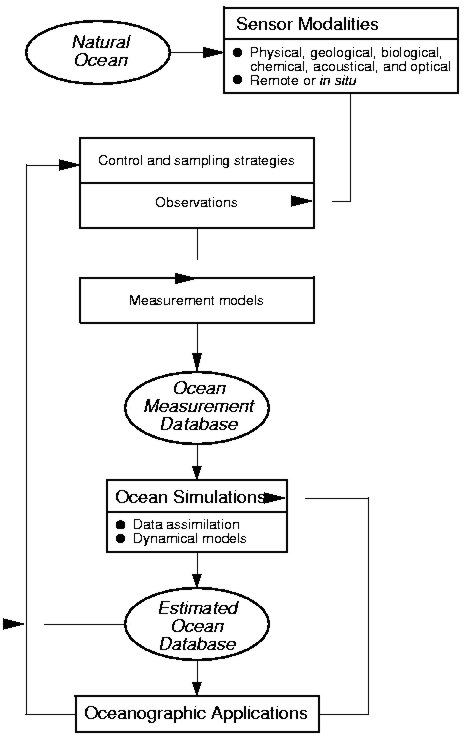
The multi-scale adaptive sampling carried out in real-time during MBST-98 is illustrated in Figure 2. The optimal strategies were subject to weather and operational constraints. The R/V Able-J (Panel a) was used to sample the Bay scales and the extended large scale via the zigzag in the Gulf of Maine and over Georges Bank). The R/V Oceanus (Panel b) sampled the mesoscales, outside of Cape Cod Bay, and in the open boundary forcing regions. The R/V Lucky Lady sampled the mesoscale (Panel c) and submesoscales (Panel d), mainly in Cape Cod Bay. The Odyssey AUV's (Panel e) sampled the submesoscales in Cape Cod Bay. Finally, the REMUS AUV's (Panel f) sampled the turbulent scales in Cape Cod Bay.
Figure 2: Adaptive sampling on multiscales during MBST-98 (note change of map scale).
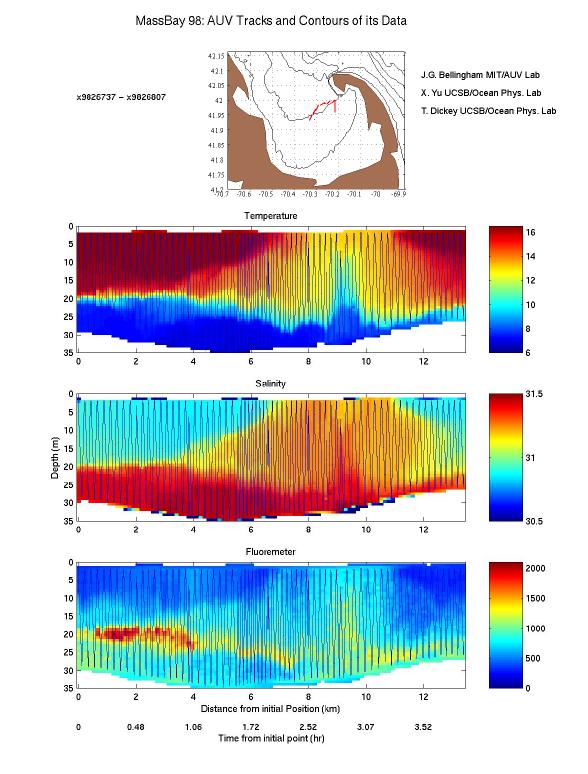
The top two panels of Figure 3 are representative of the micro- and sub-meso scale data collected by the REMUS and Odyssey AUVs. The REMUS AUV (Figure 3a) sampled velocity and temperature microstructure, mean vertical shear of horizontal velocity, and stratification along horizontal trajectories. These data enable estimation of dissipation rate, eddy viscosity, and eddy diffusivity. Along the edge of a gyre in Cape Cod Bay, at 9 m depth, the dissipation rate ranged between 1 x 10⁻⁹ and 7 x 10⁻⁸ W/kg. Correspondingly, eddy diffusivities (eddy viscosities) were approximately of order 1 x 10⁻⁶ to 4 x 10- 5 (3 x 10⁻⁵ to 2 x 10- 6) along the trajectory. The Richardson number profiles were calculated to be of order 10-1 along this track. For the gyre center, at 18 m depth, the dissipation rate ranged between 1 x 10⁻⁸ and 3 x 10⁻⁸ W/kg. Eddy diffusivities were approximately of order 5 x 10⁻⁶ to 1 x 10- 5 along the trajectory. The Odyssey AUV (Figure 3b) deployed an optical backscatter and chlorophyll fluorescence fluorometer (Yu, et al., 1999). A thin chlorophyll maximum layer (~5 m thick) is often evident in the backscatter and fluorometer data at roughly 20 m (bottom section). This layer typically lies near sharp vertical density gradients with vertical gradients in temperature of ~8 degrees over less than 5 m and in salinity of ~0.7 psu over less than 5 m. Several horizontal patches of phytoplankton are evident. The data show phytoplankton variability related to small mesoscale and local upwelling features.
Satellite SST, SSC (color) and SSH (Gulf of Maine) provided bay scale and large scale coverage. The bottom panel of Figure 3 is a Synthetic Aperture Radar (SAR) image which links the large and small scale circulation patterns and features and indicates the symbiosis provided by multiple platforms.
|
|
Figure 3: (Top-left) REMUS AUV data; (Top-right) Odyssey AUV measurements (temperature, salinity, fluorometer); (Bottom) Synthetic Aperture Radar (SAR) image of Cape Cod Bay
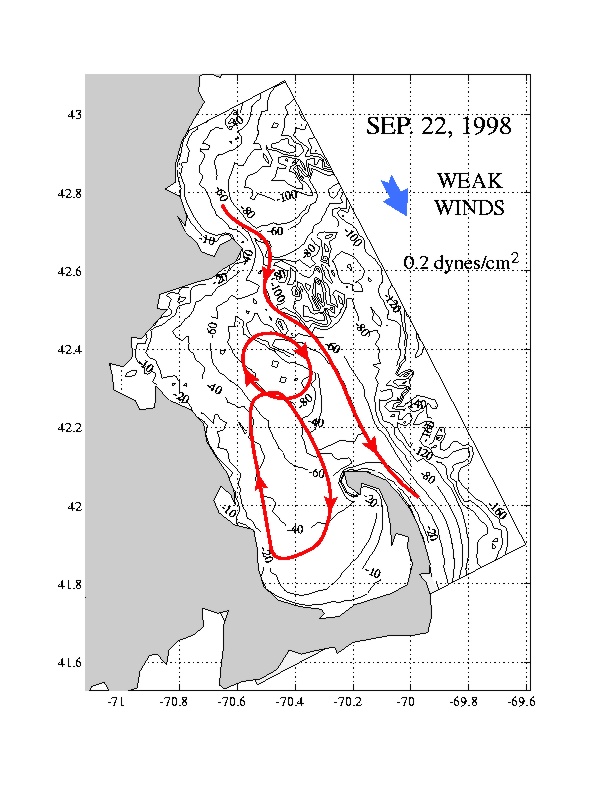
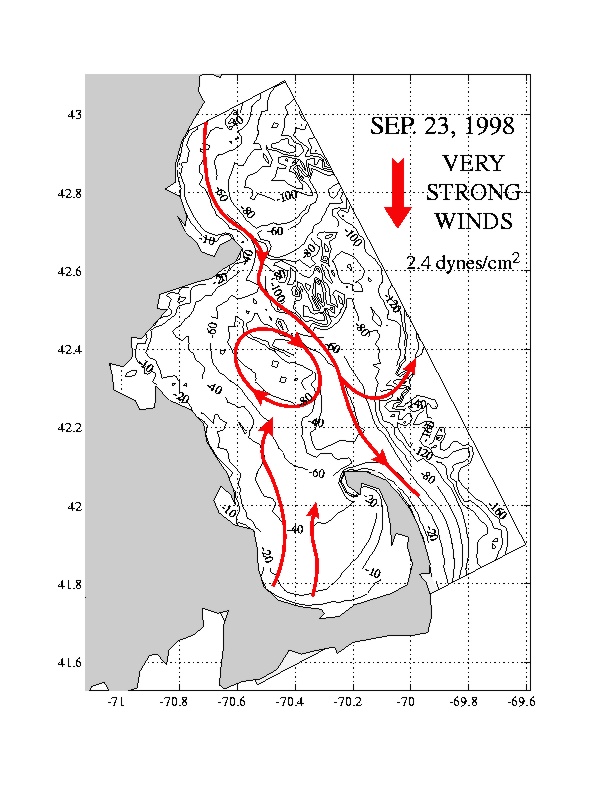
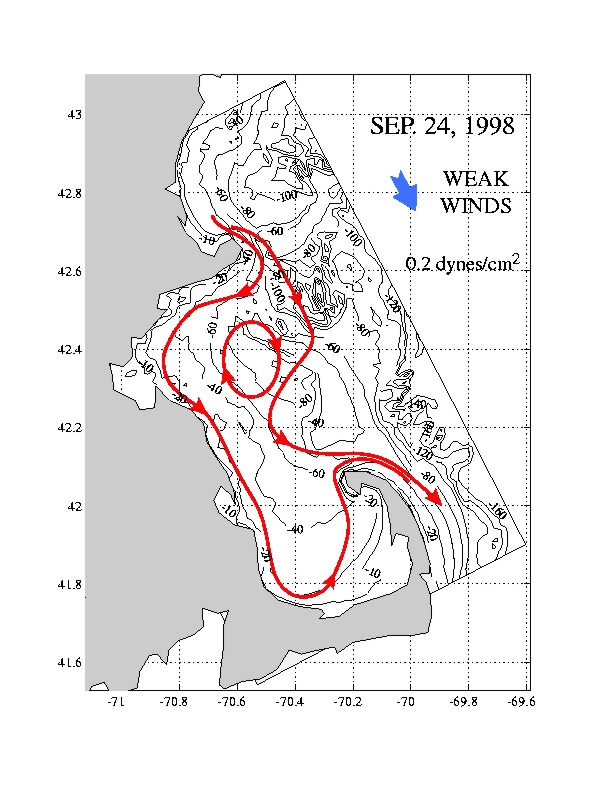
Figure 4, from model results with data assimilation, exemplifies the variability of the general multiscale circulation. Dynamically, much more variability than previously described was found in the circulation structures. Strong wind events can control the qualitative structures of the buoyancy flow. The Gulf of Maine current can have three branches: the Mass. Bay coastal current, one which enters the Bay (but not Cape Cod Bay) and then exits at Race Point, and one which flows along Stellwagen Bank without entering Mass. Bay. A Cape Cod Bay gyre can be cyclonic, anti-cyclonic or absent. For several days following a wind event, the structure of the buoyancy current is maintained by a combination of inertia, topography, coastal geometry and internal dynamics. Sub-mesoscale vortices form between branches and filaments of the buoyancy Gulf of Maine current and/or mesoscale gyres.
|
|
|
Figure 4: Circulation schematics for 22-24 September 1998
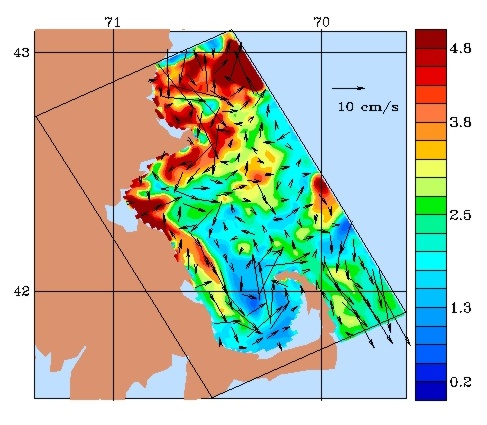
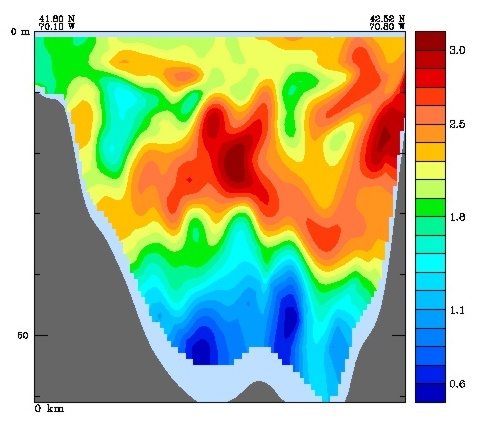
During real-time modeling, physical data was assimilated, while the coupled biological model was initialized and run forward. Biological data is currently being assimilated. Figure 5a shows the chlorophyll-a concentration at 10m. Figure 5b is a cross-section of zooplankton concentration. Multi-scale patchiness is clearly visible. Higher concentrations occur: northeast of Cape Ann and near Boston Harbor because of advected nutrients, over Stellwagen Bank due to tidal mixing, and along the coastline, due to wind driven upwelling and episodic wind mixing. Modeled subsurface chlorophyll maxima agreed well with Fig. 3b. The coupled dynamics were much more vigorous and diverse than previously thought to be the case in the fall.
|
|
Figure 5: (Left) Chlorophyll-a with overlying velocity vectors; (Right) Vertical section of zooplankton concentration along the entrance of Massachusetts Bay, from Race Point to Cape Ann. (from Besiktepe et al., 1999)
4. LOOPS OBJECTIVES AND ACCOMPLISHMENTS
The overall goal of this project has been to develop the concept of a generic, versatile and portable national littoral laboratory system, including the: (1) overall integrated systems concept, consisting of - a) a modular structure for linking, with feedbacks, models, observational networks and data assimilation algorithms and b) an efficient and robust integrated system software architecture and infrastructure; and, (2) scientific and technical basis for - a) the application of LOOPS to scientific research and to societal needs, including environmental and naval, and b) the portability of LOOPS to diverse regions of the global coastal ocean. Specific scientific and technical objectives have been to: (1) explore and define the conceptual basis of the overall system; relating structure, components and linkages to a defined range of coastal processes, regions and applications; (2) define and design the system infrastructure and software architecture, including the LOOPS database management system, communication protocols, visualization tools and support algorithms; (3) investigate implementations of LOOPS and sampling strategies for a selected set of interdisciplinary processes and generic applications; and, (4) explore issues in implementing aspects of the LOOPS concept for real time nowcasting and forecasting with adaptive sampling and data assimilation, using a mix of platforms and interdisciplinary sensors on multi-scales. The accomplishments are presented in Table 1.
The system concept and the MBST-98 experiment are discussed above. Additionally, collaboration between the partners has led to the development of a fundamentally new formulation of the integral acoustic measurement problem which is totally consistent with the traditional ocean data assimilation concept, allowing full field acoustic data to be assimilated into an ocean forecast in total symmetry with traditional point measurements and satellite remote sensing data (Elisseeff and Schmidt, 1999). The result is an ocean acoustic now- and forecasting capability with consistent handling of measurement and model errors. An advantage of this Acoustic Data Assimilation (ADA) approach is that it is not dependent on a linearized, perturbational measurement model such as travel-time Ocean Acoustic Tomography (OAT), but can be based on full-field acoustic data. It also provides a reformulation of previous full-field Matched Field Tomography (MFT) approaches. The ADA approach is multidisciplinary; at each step in the iterative forecasting solution both the acoustic and ocean circulation models are involved, and inherently strongly coupled. The ADA approach joins a small group of interdisciplinary ocean forecasting capabilities which will be important benchmarks for modern distributed computational infrastructures. Also, research towards efficient parameterizations of sub-grid scale processes was initiated, tuning the scale-dependent eddy diffusions and viscosities of the HOPS Shapiro filter based on REMUS AUV turbulence/optics measurements. Quasi-real time sub-gridscale assimilation of turbulence measurements is under development.
The LOOPS group thanks the National Ocean Partnership Program for their support of this research and individual investigators acknowledge support of various grants. This is LOOPS contribution 2. We thank Mr. Wayne Leslie for his efforts in preparing this manuscript.
Table 1: LOOPS Accomplishments
Concept Development
- defined conceptual basis for LOOPS software and databases
- researched data and software standards
- designed distributed LOOPS architecture around the CORBA concept and wrappers for legacy models
- web-based editors for metadata and executive system for workflows under development
Systems Integration
- implemented a prototype CORBA based system for HOPS and MIT acoustic models
- integrated UCSB optical sensors on MIT Odyssey AUVs
- identified technical issues for integration of HOPS and AUV simulation software
Interdisciplinary Multiscale Data Assimilation and Interactive Processes
- developed acoustical/physical data assimilation (ADA)
- research to determine model subgridscale parameterizations from turbulence measurements underway
- designed sea trial for coupled variabilities among physical, phytoplankton and zooplankton fields
- carried out OSSE in Mass. Bay for the Sea Trial with sensitivity analyses
Real-Time Demonstration of Concept
- Massachusetts Bay Sea Trial 15 Sep. - 5 Oct., 1998
+ 3 ships, Odyssey AUVs, REMUS AUV obtained 400+ CTDs; optical backscatter; fluorometer;
acoustic zooplankton profiler; optical plankton counter; continuous plankton recorder;
turbulence; AUV based CTD, fluorometer, ADCP, optical backscatter
+ multiple streams of remotely sensed data
+ HOPS set up in multiple two-way nested domains
+ forecasted fields and errors
+ real-time adaptive sampling (yesterday's data used today for tomorrow's forecast)
Analysis of Multiscale Data Base for Coastal Processes
- unique multiscale interdisciplinary data set to serve as basis of:
+ interactive process analysis
+ coupled biological/physical data assimilation
+ OSSE data for next predictive skill experiment
- results to date include:
+ identification of new patterns of circulation
+ new understanding of interactions of wind flow and buoyancy flow events
+ energetic fall biological blooms due to wind forcing, tidal mixing and external advection
+ modeled chlorophyll variability is in general agreement with observations - processes under study
5. REFERENCES
Elisseeff, P. and H. Schmidt, 1999: Acoustic tomography as a data assimilation problem, IEEE Journal of Oceanic Engineering, in press.
Lermusiaux, P.F.J. and A.R. Robinson, 1999: Data assimilation via error subspace statistical estimation, Part I: Theory and schemes, Monthly Weather Review, 127(8), 1385-1407.
Patrikalakis, N.M., P.J. Fortier, Y.E. Ioannidis, C.N. Nikolaou, A.R. Robinson, J.R. Rossignac and A. Vinacua, 1999: Distribution Information and Computation in Scientific and Engineering Environments, D-Lib Magazine, 5(4),
http://www.dlib.org/dlib/april99/04abrams.htmlRobinson, A.R., 1999: Forecasting and simulating coastal ocean processes and variabilities with the Harvard Ocean Prediction System, in Coastal Ocean Prediction (C.N.K. Mooers, ed.), AGU Coastal and Estuarine Studies Series, 77-100.
Yu, X., T. Dickey and J. Bellingham, 1999: Bio-optical measurements from the Odyssey AUV in Mass. Bay during the LOOPS-I experiment, Univ. of Cal., Santa Barbara, Ocean Physics Lab., Report #7
Additional references available upon request.